Thanks to Mike Brown's diligent note-taking over the years, and the huge effort to digitise those notes, undertaken by lots of people who aren't me, we can settle this.
Let's get all the nitty-gritty methodology out of the way first. These statistics exclude all numbers rounds for which the target or contestant declarations are not known. Besides that, all shows are included up to the end of series 68.
Assumptions
If one or both of the contestants solved a numbers round, the arithmetician is generally not asked for her solution. So for all these stats, I've made the assumption that the arithmetician always does at least as well as the contestants - that is, if either contestant maxed it, the arithmetician did too. I expect this assumption is nearly always correct anyway, and where it isn't, I don't see any reason to suppose making this assumption would skew the results more towards one arithmetician than the other.
The wiki, and therefore the database, doesn't record whether the arithmetician solved it in the 30 seconds or needed some extra time. So the best we can do here is just assume that if the wiki says the arithmetician solved it, they solved it, and not bother about how long it took.
What to measure
We mustn't mix results for different types of pick. Some picks, like 6 small and 4 large, are harder than others, and in the earlier years the easier selections (1 large, 2 large) were much more common. So we can't just lump them all together into one average, we've got to look at them separately.
The most obvious performance indicator is the max percentage - for each round, ask "did Carol/Rachel (or either of the contestants) correctly declare the closest possible for this round?" and work out the percentage. The problem with this is that the arithmetician doesn't usually give her working if it's not an exact solution. Also, Rachel gets told when a numbers game isn't possible (don't know if this was true for Carol as well), and this can arguably make the task of finding a non-exact but optimal solution easier - if you know that 637 isn't possible, you know not to bother looking for 91*7, for example. So to avoid this problem entirely, in all the tables below, I've only looked at the numbers games that were solvable exactly, and considered how many were solved by the arithmetician or the contestants.
Overall average
This is probably the table you want to see. It's the main table which includes all of Carol's and all of Rachel's games (up to 28th June 2013). As you can see, on average, Rachel steamrolls over Carol in all five picks.
Code: Select all
              LARGES    SOLVED     TOTAL         %           Includes all known solvable numbers games
     Carol         0       653       770    84.805
                   1      7820      8225    95.076
                   2      1303      1404    92.806
                   3       219       256    85.547
                   4       272       350    77.714

    Rachel         0       219       239    91.632
                   1      1747      1785    97.871
                   2       566       592    95.608
                   3       121       127    95.276
                   4       167       184    90.761
Breakdown by year
The table above shows four and a half years of Rachel, and 26 years of Carol. Carol's average over those 26 years is weaker than Rachel's average, but there's more to the story if we look at smaller parts of Carol's career.
When Carol was Rachel's age, she was very, very good. For example, over the whole of 1987 and 1988, there were 509 1-large games which were solvable exactly. Not a single one over those two years went unsolved in the studio.
Let's look at 80s Carol...
Code: Select all
              LARGES    SOLVED     TOTAL         %           Includes all known solvable numbers games, 1982-1989 and 2009 onwards
    80s Carol      0        69        74    93.243
                   1      1333      1366    97.584
                   2       288       293    98.294
                   3         6         7    85.714
                   4         3         4    75.000

    Rachel         0       219       239    91.632
                   1      1747      1785    97.871
                   2       566       592    95.608
                   3       121       127    95.276
                   4       167       184    90.761
How about 90s Carol?
Code: Select all
              LARGES    SOLVED     TOTAL         %           Includes all known solvable numbers games, 1990-1999 and 2009 onwards
    90s Carol      0       235       256    91.797
                   1      2810      2904    96.763
                   2       298       324    91.975
                   3        74        83    89.157
                   4        91       107    85.047

    Rachel         0       219       239    91.632
                   1      1747      1785    97.871
                   2       566       592    95.608
                   3       121       127    95.276
                   4       167       184    90.761
Code: Select all
              LARGES    SOLVED     TOTAL         %           Includes all known solvable numbers games from 2000 onwards
    00s Carol      0       349       440    79.318
                   1      3677      3955    92.971
                   2       717       787    91.105
                   3       139       166    83.735
                   4       178       239    74.477

    Rachel         0       219       239    91.632
                   1      1747      1785    97.871
                   2       566       592    95.608
                   3       121       127    95.276
                   4       167       184    90.761
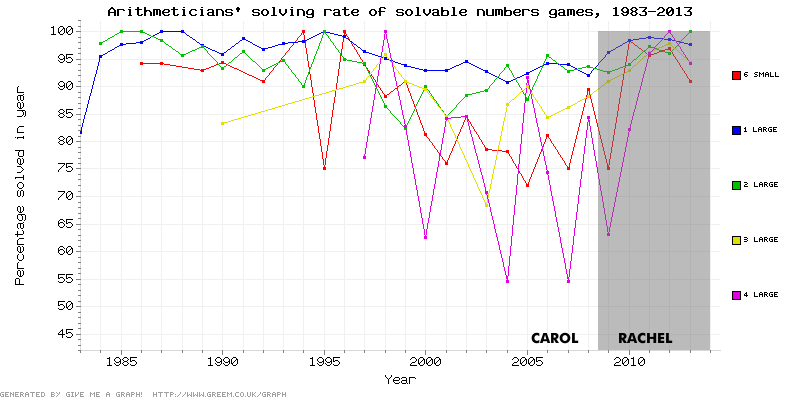
Initially, Rachel solved relatively few 6 small and 4 large rounds, but she turned that around pretty quickly. No prizes for guessing when Rachel discovered the 4 large tricks. And yes, in 2012, all solvable 4 large games (34 of them) were solved in the studio. Not sure how much of that is due to Rachel and how much to Jack Worsley, but there it is. (19 of the 34 were solved by one or both contestants.)
So we've learned that Carol was as good as Rachel is now when she started, but her average is dragged down by the later years. Since 2011, Rachel has had a 90% solve rate in all five numbers picks. In 2011 and 2012 they were all greater than 95%. We're only half way through 2013, so it might yet be true for this year as well. She solves them just as consistently as Carol did at her best in the 1980s - and back then, 1 large and 2 large were the only picks worth practising.